Check Up Page Speed And Web Issues
Peformance
Accesibility
Best Practices
SEO
PWA
Performance
Accesibility
Best Practices
SEO
PWA
In the latest version of the Pagespeed Test tool, users can view the search history with the "local history" feature and check the SEO score using the Progressive Web APP feature. We specialize in these two additional features for you to use in optimizing your website to be faster and able to provide an experience like using a mobile application.
In the latest version of the Pagespeed Test tool, users can view the search history with the "local history" feature and check the SEO score using the Progressive Web APP feature. We specialize in these two additional features for you to use in optimizing your website to be faster and able to provide an experience like using a mobile application.
What's New
Last update Oct 13, 2023
30 Tools for Countless Solutions! cmlabs has reached a remarkable milestone with the release of 30 cutting-edge tools designed to empower businesses and individuals in the digital realm. All 30 tools, from Test & Checker, Sitemap.XML, and Robots.TXT to various JSON-LD Schema Generator, have been launched to address specific needs and challenges across diverse industries. Together with cmlabs tools, you can stand at the forefront of technological advancements. Try our tools based on your needs now!
Notification centerSEO Services
Get a personalized SEO service and give your business a treat.
Digital Media Buying
Get a personalized SEO service and give your business a treat.
SEO Content Writing
Get a personalized SEO service and give your business a treat.
SEO Political Campaign
Get a personalized SEO service and give your business a treat.
Backlink Services
Get a personalized SEO service and give your business a treat.
Other SEO Tools
Broaden your SEO knowledge
Free on all Chromium-based web browsers


PageSpeed Test
PageSpeed Test is a free tool from cmlabs that you can use to check website performance. This tool helps you monitor the performance of an entire web page on both desktop and mobile devices and provides instructions on how the web page can be improved.
The report generated from the Pagespeed test shows lab records that are useful for you to find website performance issues. This report is measured against a controlled set of metrics, with the aim of identifying what kind of web pages can provide a good user experience.
PageSpeed Test from cmlabs is integrated with Lighthouse to display website performance assessment results. There are several metrics used to assess website performance, such as performance, accessibility, best practices, SEO, and PWA. Check out the explanation of each metric below:
Performance is used to ensure that your web pages are optimized for users so that they can see and interact with your website. There are several metrics that affect web page performance ratings, including:
Core Web Vitals
Core web vitals are the factors that Google uses to determine user experience. In the performance assessment, you'll see some metrics from the following core web vitals:
Time to Interactive (TTI)
This is the time it takes the website to load most of the content until the website can respond to user input quickly (ideally less than 50ms). In other words, this is the time it takes for a web page to become fully interactive.
Speed Index
Is a time that shows how fast the loading process is until all pages can be displayed clearly in the viewport, the faster the time the better the score. Ideally, the speed index time is no more than 3.4 seconds.
Total Blocking Time (TBT)
This is the total time the page was unable to respond to user input. Obtained from the sum of all time periods between First Contentful Paint (FCP) and Time to Interactive. A good TBT value is no more than 200ms.
Accessibility is a metric used to assess the ease with which users can access your page, especially for users with physical or cognitive disabilities. Therefore, it is important to create a design that is easily accessible to everyone. Some aspects will be checked such as HTML tags, alt tags, ARIA landmarks, and others.
This metric is used to examine some areas for improvement of your overall website. Things to note in order to score well on this metric are to keep your website secure (use a secure protocol like HTTPS), create a good user experience, avoid using outdated technology, and more.
Apart from checking performance, this tool also allows you to see if your web pages have been optimized to rank better in organic search. There are a few things to keep in mind in order for you to score well on this metric:
Checking the website through the PageSpeed Test tool from cmlabs also provides validation results for the Progressive Web App (PWA) aspects. One of the criteria that you need to pay attention to when implementing PWA is to provide a website that can be accessed quickly from various locations and types of devices.
The report contained in the PageSpeed Test shows a score that summarizes the performance of the website. We use Lighthouse's help to collect and review your web page records. Furthermore, Lighthouse will provide a score that corresponds to the assessment of your web performance.
In the PageSpeed Test assessment, the scores obtained by a website are divided into three categories, namely:
Scoring is influenced by some of the previously mentioned metrics. Furthermore, websites that manage to achieve maximum results on the assessment of each metric will get a higher score. In this case, if your website manages to get a score of 90 to 100, then your website has performed well.
Websites that get a score of 50 to 89 are included in the category of websites that have been running well, but need improvement. This can be caused by one thing or another, such as an assessment of one of the metrics that are less than the other.
To improve website performance, you need to know what metrics still need improvement. Then, you can decide on a strategy to solve the problem.
If your website gets an assessment score in the range of 0 to 49, then you need to be wary. This means that your website is underperforming and needs repair as soon as possible. Take a look at the Pagespeed report to see which areas need improvement.
Doing a performance check using a Pagespeed test is mandatory. Because this can help you determine a website optimization strategy.
The following guide contains how to use PageSpeed Test you can do. Follow each step to the end.
As a first step in starting a website page speed check, you need to open the PageSpeed Test page. On that page, you will see some of the features that the tool has. Starting from adding the URL to be checked for page speed, displaying the results of the page speed check, to the page speed checking history that you have done before.
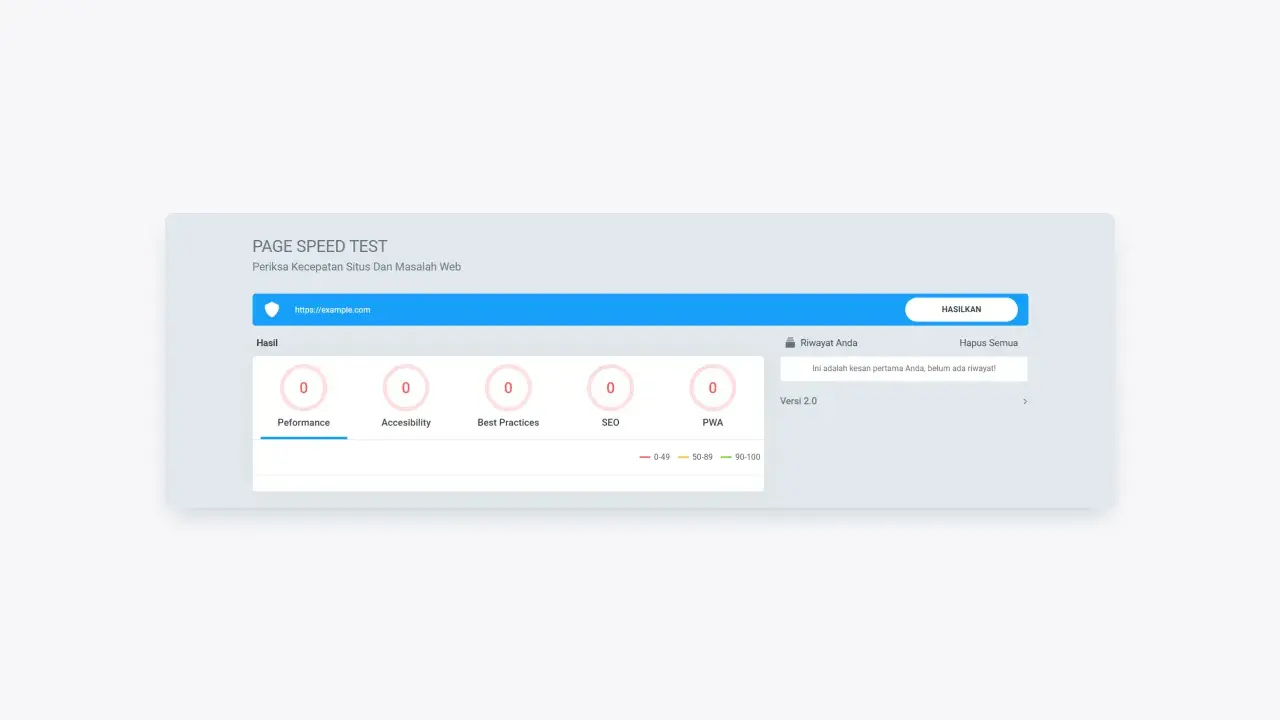
Figure 1: PageSpeed Test page view from cmlabs
In order to be able to check page speed, you must first enter the website URL in the field provided. Make sure you have entered the URL in the correct format (e.g https://example.com). Next, click the "Generate" button to give the command to this tool to start checking pagespeed on the website.
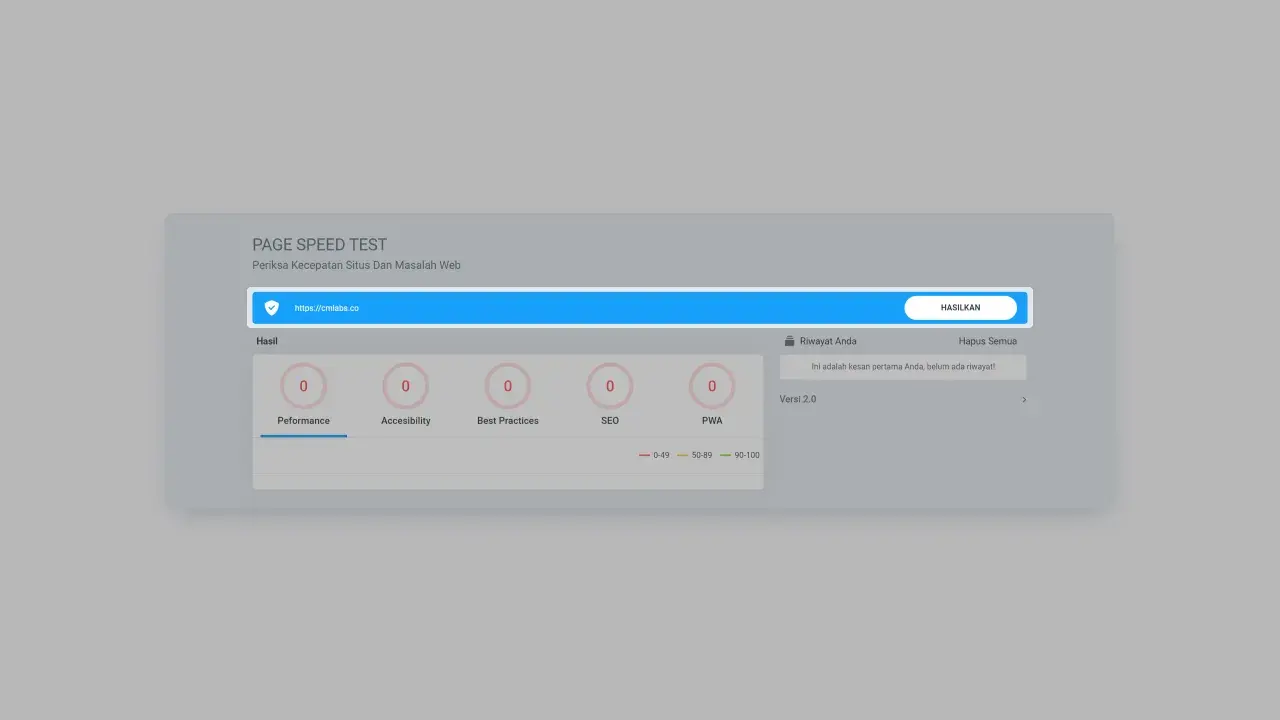
Figure 2: The display when the user has entered the website URL in the provided field.
You need to wait a while until the pagespeed check process is complete. Although this tool can be accessed for free, the pagespeed checking data displayed is quite complete. Some of the metrics you can find in your PageSpeed Test results are:
This metric displays the results of testing the overall website performance. Starting from the test results of core web vitals metrics, time to interactive, total blocking time, to speed index. The value categories are divided into good (90-100), need improvement (50-89), and bad (0-49).
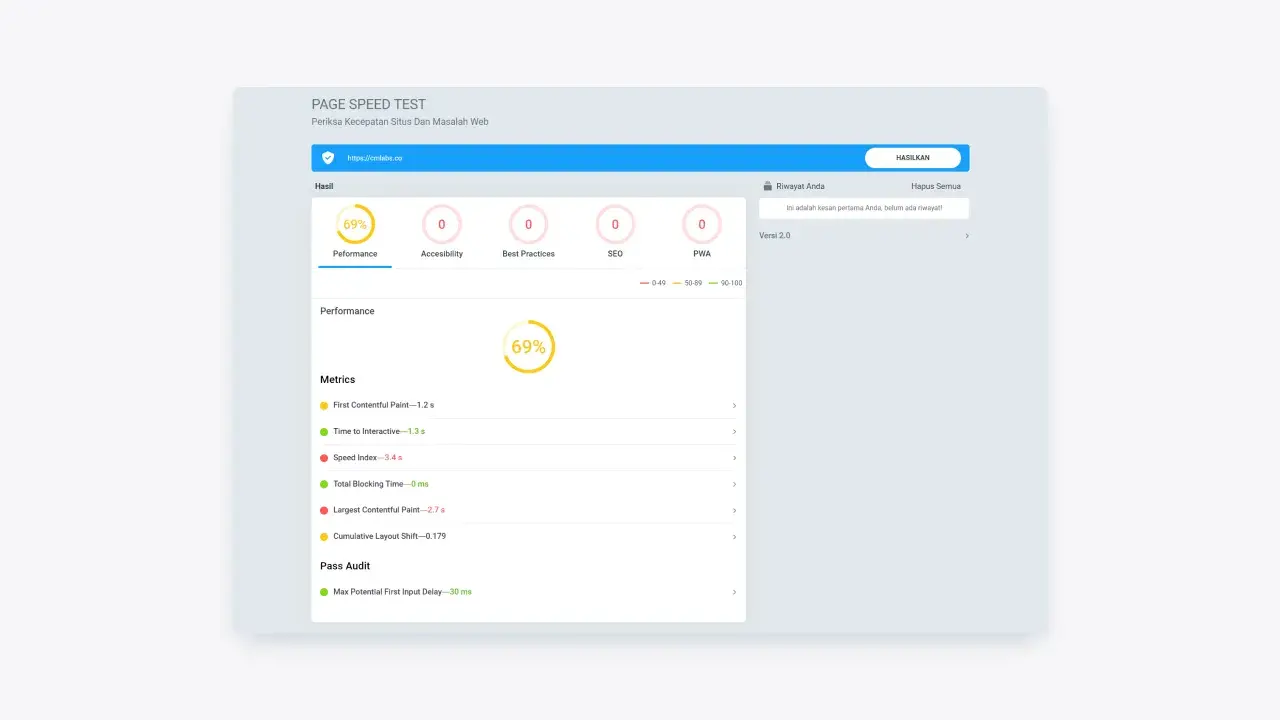
Figure 3: Performance assessment results from websites tracked using PageSpeed Test
This metric displays the results of your web page accessibility assessment. The accessibility of a website is assessed based on how easily the website can be accessed by users.

Figure 4: Detailed page accessibility assessment of websites tracked using PageSpeed Test
This metric will display a report containing information on whether your website has implemented best practices in website creation. If the assessment results still need improvement, this is the right time for you to improve website performance.
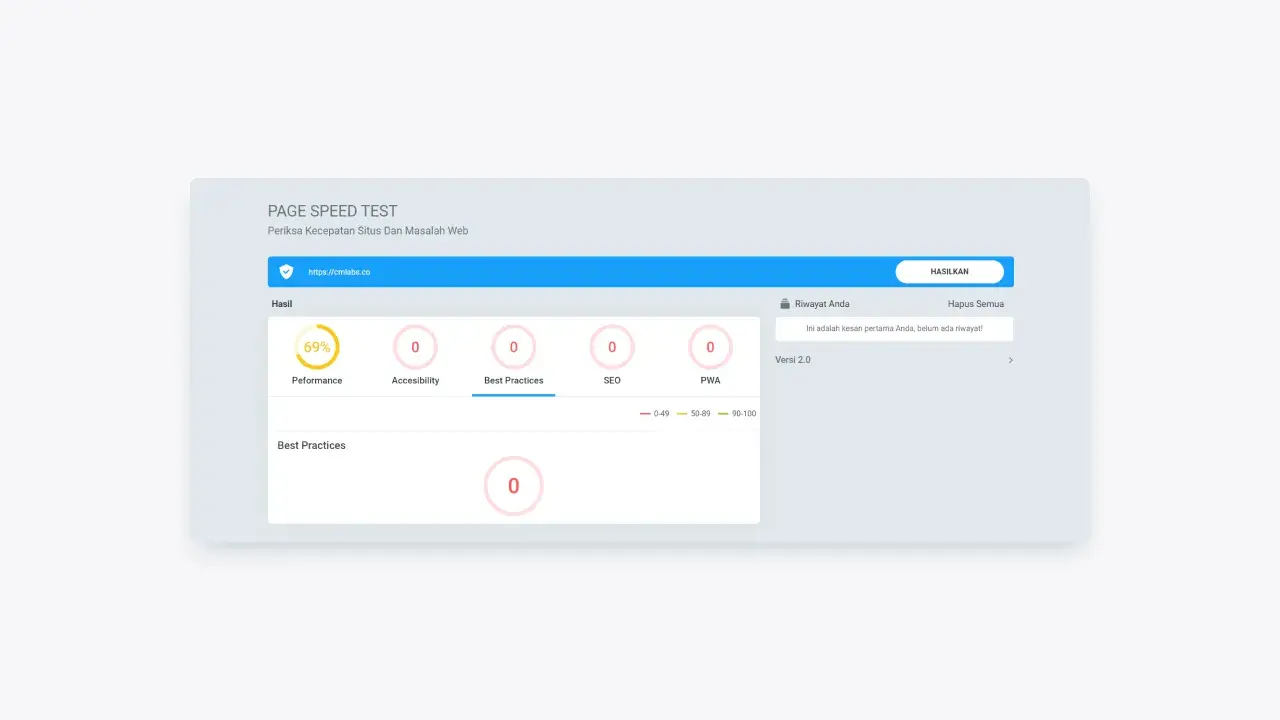
Figure 5: Best practice metrics assessment results on tracked websites
You will also find the results of the SEO assessment of your website. The following report will contain information on whether your website has been optimized on search engines or not. With this report, you can find elements that need to be improved on your website.
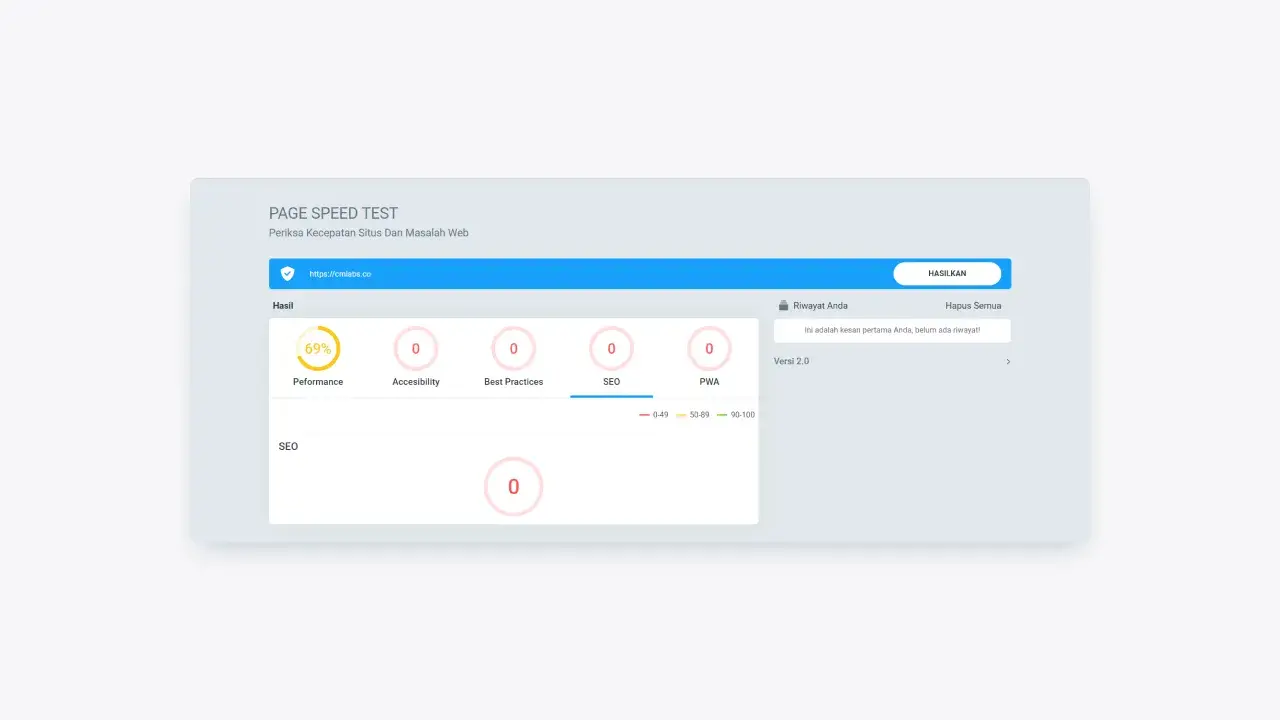
Figure 6: Detailed results of Search Engine Optimization (SEO) quality assessments on tracked websites
In the following assessment results, you will see whether your website has met the Progressive Web App (PWA) criteria. If the website has not implemented PWA optimally, this can be a sign that you have found a space that needs to be improved on your website. That way, the website can provide a better user experience.

Figure 7: Detailed Progressive Web App (PWA) assessment results on tracked websites
The last thing you can do using PageSpeed Test is look at your history of using the tool. In the list, you will see a list of website URLs that you have checked using the PageSpeed Test tool from cmlabs.
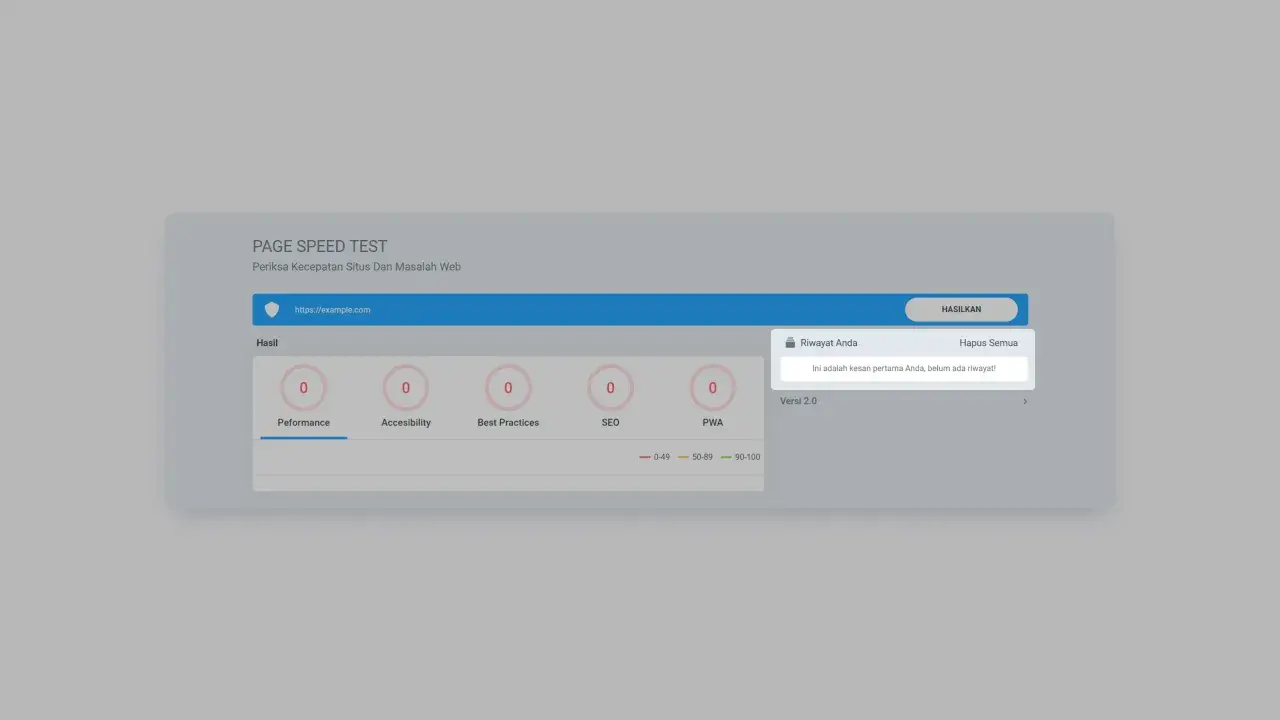
Figure 8: List of pagespeed test usage history
Some cmlabs free tools require login after 5 times of use, Pagespeed test is one of them. If you have used it 5 times, our system will automatically display a message stating that you have reached the usage limit.
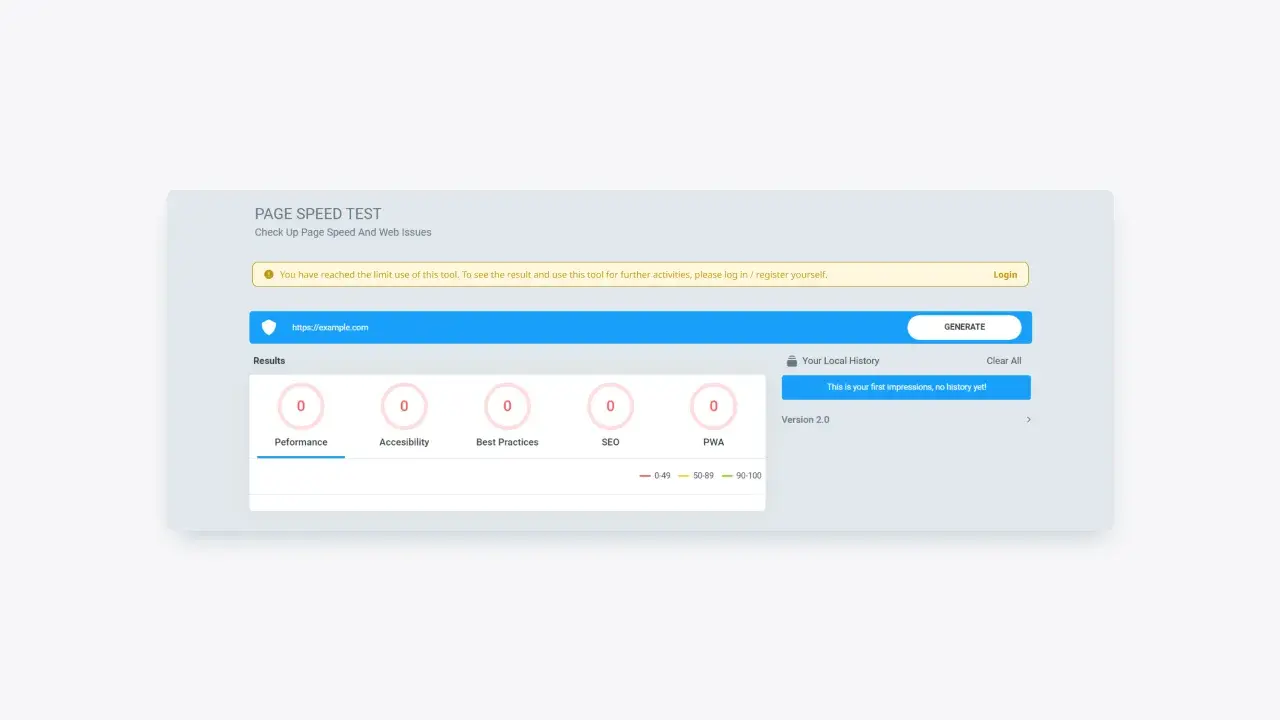
Figure 9: Warning usage has reached the limit. In this warning, there is a login button that directs to the login page.
You can log in by clicking the login button on the warning message that appears. Next, you will be directed to the cmlabs login page. Please enter the required data, or you can log in via Google.
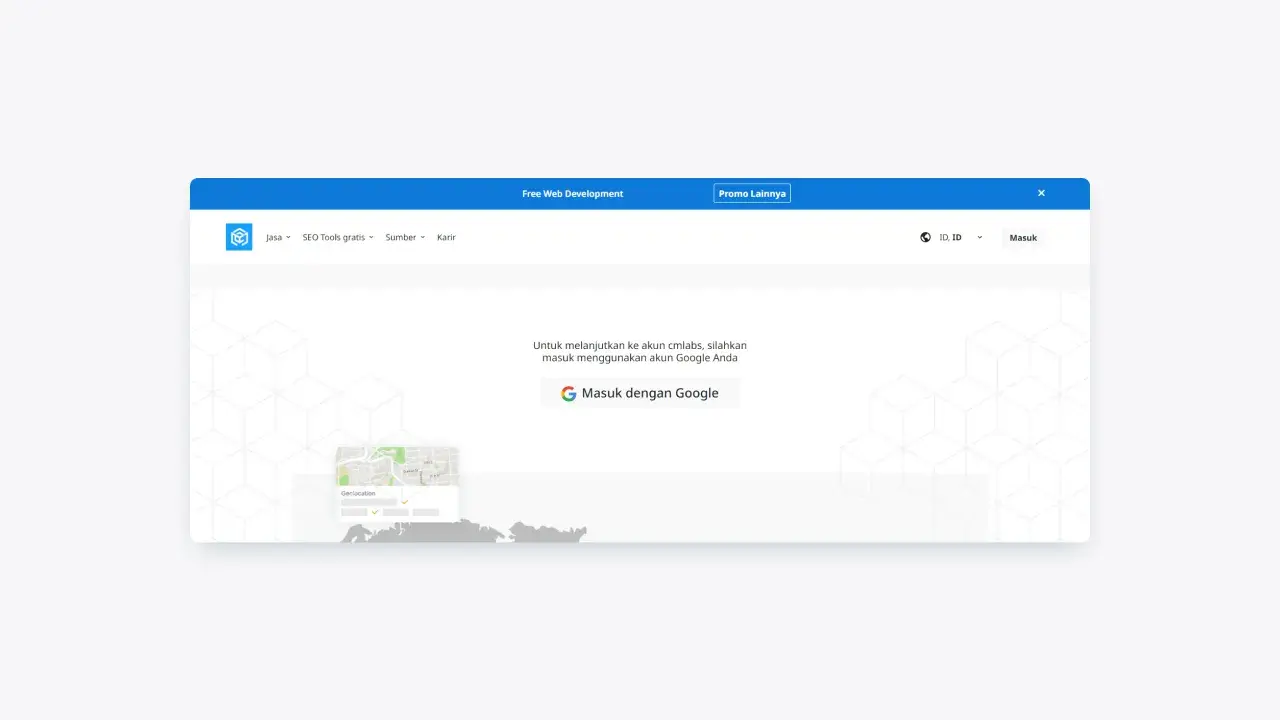
Figure 10: cmlabs login page
Once you've successfully logged in, you'll be able to go back to using this tool to do page speed testing for free. By logging in, the system can save historical data on the use of this tool in the last a year.
Read More
Edited at Oct 13, 2023
The Search Engine Optimization (SEO) Starter Guide provides best practices to make it easier for search engines to crawl, index, and understand your content.

Jakarta, Indonesia (HQ)
cmlabs Jakarta HQ Jl. Pluit Kencana Raya No.63, Pluit, Penjaringan, Jakarta Utara, DKI Jakarta, 14450, Indonesia
(+62) 21-666-04470These strategic alliances allow us to offer our clients a wider range of SEO innovative solutions and exceptional service.
Psst! Hey there, SEO Stats and Tools SEO company! If you've ever planned of conquering the Indonesian market, you've come to the right place!

These strategic alliances allow us to offer our clients a wider range of SEO innovative solutions and exceptional service.
Psst! Hey there, SEO Stats and Tools SEO company! If you've ever planned of conquering the Indonesian market, you've come to the right place!